For all the Fed buildup, markets ended up not doing much for the week as a whole. Equity markets generally did well in the middle of the week on hopes that the Fed would leave rates unchanged. However, markets decided that wasn't such a good thing after all, with rate uncertainty likely to persist, maybe through the end of the year.
The oral comments and changes in Fed economic forecasting were not terribly reassuring relative to the underlying strength of the U.S. economy outside of the consumer. Additionally, the Fed still seemed intent on raising rates in 2015 despite standing firm for now, as indicated by the Fed Governors Fed Funds Projections.
The Fed's own tone of uncertainty and fear of acting decisively certainly isn't a positive for businesses or investor confidence, either. More than anything else, markets hate uncertainty.
For the week, U.S. equity markets were virtually unchanged, and Europe was down about a percent on worries about the Greek elections on Sunday. Emerging markets, despite relatively soft economic news, managed about a 1% gain, most likely because U.S. rates did not go up, reducing the short-term threat of capital outflows. Commodities had another sinking spell, dropping 1.4% for the week, most likely because of a generally softer economic outlook from the Fed. Bonds were the star performers, based on the Fed's decision and softer Fed forecasts. The rate on the U.S. 10-year bond dropped from 2.18% last week to 2.13% on Friday.
The economic news was a little tricky this week because performance was highly dependent on which starting points were chosen and how one treated revisions to past months. Retail sales looked OK, certainly no cliff dive, as year-over-year sales remained at a very healthy 3.7%, adjusted for inflation. Housing starts and permits looked good, too. Although some of the month-to-month data wobbled a bit, year-over-year growth rates were still solidly in the double digits with little to no diminution of the trend. Unfortunately, the manufacturing sector continues to struggle, and full-year growth rates continue to erode, according to the most recent industrial production report. However, there were some sectors, such as machinery, that managed some nice gains month to month.
The Fed stands pat after all
The Fed opted to kick the can down the road a bit, and decided not to raise rates at its September meeting. That was what about 75% of market participants had anticipated. While the Fed admitted that employment and inflation levels were approaching its goals, it worried that slower international economic activity would potentially depress U.S. growth rates (and employment) while a strong dollar was likely to keep inflation lower for longer. It also had some concerns that the unemployment rate might not be the optimal metric for the labour market given a lower labour market participation rate and a continued high rate of part-time employees who want to be working full time. Given the uncertainty, it didn't feel an imminent need to raise rates. On the other hand, 13 of 17 governors thought that rates would be raised in 2015, hardly reassuring for those who want low rates indefinitely.
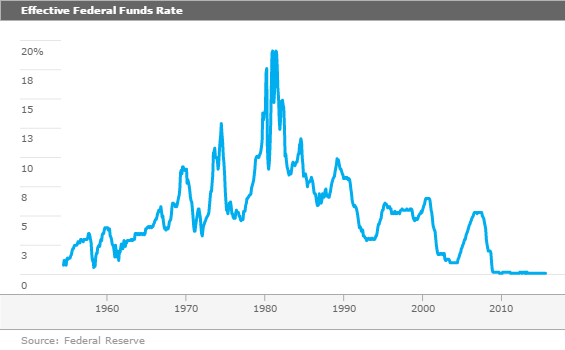
Plus, their longer-range forecasts show rate increases over the next year, albeit at a pace that is well below normal cyclical patterns. Current Fed governor forecasts have the Fed Funds moving up from 0.12% currently to just 1.4% by the end of 2016, slowly working its way to 3.4% by the end of 2018. In total that is just barely over a 3% increase over more than three years. The relatively slow pace and small size of the total increase are all well below history.
For some perspective, the last big set of Fed increases was in the early 2000s. Then, rates moved up from 1% to over 5% in just about two years. And that was one of the more modest bouts of Fed rate increases. However, those governors could be wrong in their forecasts, as they often are.

Interestingly, the Fed modestly increased its economic forecast for 2015 and lowered its forecasts for 2016 and beyond. Overall its forecast is now more in line with our thinking of 2.0%-2.5% real GDP growth as far as the eye can see. Although it raised the 2015 forecast from 1.9% to 2.1%, that forecast looks way too low to us as it implies second-half growth of just a smidge over 2%. Our forecast is for very close to 3% growth in the back half of the year.
Given what we have all seen so far in the third quarter (strong autos, improved retail sales and housing, 3% growth or so in the third quarter is a real possibility. That would mean the Fed is expecting the bottom to fall out in the fourth quarter with GDP growth of just 1% or so. It could happen with an external shock, but that just doesn't seem to be the most likely case to us. If the Fed believes its own forecasts of strong deceleration, it most likely would not be raising rates at all in 2015.

The Fed also reduced its core inflation forecast and its unemployment rate forecast modestly in 2016 and beyond. Meanwhile, it tweaked 2014 inflation slightly higher. Also, the Fed went out of its way to say it would continue to buy more bonds to replace all of the bonds that it held that were maturing on its US$4 trillion balance sheet. Stopping that rollover process would have been a backdoor method of tightening monetary policy.
As we have said, we really wish the Fed would just get on with it and end the circus atmosphere surrounding each meeting. Rumours were that traders were passing around Yellen's horoscope prior to the meeting (she's a Leo, for those who need to know). Investors and traders appear to be more interested in placing short-term bets in a racetrack-like atmosphere than considering the long-term trends. A quarter percent hike is highly unlikely to have any impact whatsoever on the real economy. And it gives the Fed a little more wiggle room to eventually lower rates in case a slowdown develops. A small move soon would also have tested the waters a bit in terms of markets. We are adamant that the first rate increases or even the governors' expectation of a 1% hike in 2016 would have little impact on the real economy. The small increases would be barely visible against double-digit credit card rates or even auto loans; longer-term rates that drive mortgage rates are already up significantly.
What we don't know is how much equity markets would be affected by the higher rates. Furthermore, all of the dawdling and on-again off-again rate increases certainly aren't helping business confidence. If the Fed is so scared it won't raise rates even a tiny amount on a silly low base rate, why should businesses feel like they should take a chance and invest aggressively? Especially when the Fed, with all of its statisticians, can't get seem to get its forecasts right, and the Fed chairman talks of continuous uncertainty. The dawdling certainly hasn't helped the U.S. stock market either, which is now down close to 7% in 2015. Again, we caution readers that watching the real economy is far more productive than watching the Fed Circus every month. On that front, the news is still good. In fact, we still believe the economy in 2015 could very modestly exceed our 2.0%-2.5% long-term forecast.
Inflation still tame
Overall inflation rates for August were modestly lower than expectations with headline numbers showing deflation of 0.1% month to month and year-over-year inflation of just 0.2%. Excluding food and energy, month-to-month prices were up 0.1%, and 1.8% year-over-year, both roughly in line with where they have been for the past several months. Although the Fed favours another inflation metric that is temporarily lower, the CPI inflation rate excluding food and energy is not much lower than the Fed's target of 2.0% core inflation. The three-month moving average data paints much the same picture.

The core inflation rate is close to Goldilocks territory and very much in line, to maybe just a tad lower than what both employees and employers are expecting, which is still in the 2% range. However, with both gasoline and oil prices on the decline again, the day of reckoning when core and all-in inflation equalize has probably been pushed off until 2016. This spring, we had some fears that core prices would remain about 1.8%, and that potentially rising gasoline prices could push headline inflation back over 2% as early as November or December. However, the oil industry's seeming inability to turn off the spigots and sharply rising productivity in the oil patch seemed to have pushed off the date when oil and especially gasoline prices will stabilize, helping consumers keep more money in their pockets through the important holiday season.
Commodity-related items are driving the inflation rate to low levels
This month, we are adding a new way to analyze inflation: by major category instead of detailed sector data. This way, it is easier to see why Fed action to raise inflation rates is potentially doomed.

First, it's very interesting to note the weights. Food and energy, which everyone so willingly throws out of their calculations, constitute almost a quarter of the CPI. It's also interesting to note that if you throw in other physical goods, that combination still constitutes just 42% of the CPI and services account for a remarkable 58% of the index.
Prices of services, despite rapidly falling air fares, are up a relatively strong 2.6%. Not exactly zero inflation. Meanwhile, commodities (goods) are in a world of deflation. A broad swath of goods is down in price on a full year-over-year basis, including furniture, appliances, apparel, sporting goods, used cars, electronics and personal-care products. Lower raw material input prices (steel, copper and energy) and a strong U.S. dollar have really brought down the price of physical things, especially those that are imported.
Services, which are less subject to non-U.S. competition, continue to plow ahead. If commodities ever find their bottom, which is mostly outside the realm of the U.S. Federal Reserve, inflation would look a lot higher than many suspect. In fact, many readers have commented that their inflation rate is a lot higher than what the government calculates. Perhaps this is because their shopping basket includes more services (dinner out, rent, tuition, car insurance and sporting event tickets that all have seen large increases). Just maybe the Fed has been more successful at raising inflation than it believes.
One other thing worth mentioning is that health-care prices seem to be moderating a bit in recent months. Medical service prices are basically down over the past three months. That strikes us as a bit odd given all the expansion in health insurance coverage, which seems to be driving up demand. Seemingly that should have moved up prices, too, but it hasn't. My bet is the seasonal factors may be off for this sector because we sincerely doubt that health-care inflation has been eradicated.
Consumers not panicking yet
At almost 70% of GDP, consumer spending is what really drives GDP growth in the U.S. So far even with headlines of a slumping China, poor stock market performance and the Federal Reserve Circus, consumers have not halted their spending ways, at least according to the most recent retail sales report for August.
We will dispense with looking at the headline number this month (which was still OK at 0.2% growth all-in, month to month) that isn't inflation-adjusted. The headline data includes volatile and separately reported auto sales. Instead, we will look at the single-month-to-single-month growth rate annualized and the three-month moving average of year-over-year growth, with and without inflation. We have excluded gasoline and auto sales from our analysis. The month-to-month data is quite jumpy; nevertheless the annualized growth rate for August wasn't far off the year-over-year average, indicating the world is not falling apart. The year-over-year averaged data remains as steady at its 12-month average growth rate of 3.7%.

The sector winners and losers don't really shed much light on the situation, with the winners and losers randomly arrayed. The one pattern that did strike us as a bit odd was that both building materials and furniture were soft even as the housing market continued to pick up steam. Our only thought is that prices in both furniture and building materials continue to fall and are artificially depressing the sales metric. Only the inflation-adjusted consumption data at the end of the month will tell us the real story.

Looking at the growth of restaurant sales is a quick check of consumers' short-term mood. The news here was really quite incredible, with month-to-month sales up 0.7% and year-over-year sales up a stunning 8.2%. Grocery sales were also up 0.7% for the month, but year-over-year growth was a slower 3.0%. With our three key consumer health metrics, restaurants (short-term), autos (medium-term), and housing (long-term sentiment), consumers are clearly not showing the same doubts as businesses and the Federal Reserve.
Housing starts still looking very strong despite monthly drop (by Roland Czerniawski)
This week's reports pointed to continued strength in the housing market. Permits advanced 3.5% (1.17 million units annualized) in August, which translates to a still-high, year-over-year three-month moving average, growth rate of 16.8%. This number is likely to decline in September as both May and June, the strongest months of the year, will drop of out the rolling three-month average. Nonetheless, it is still very likely that permits, and quite possibly other housing indicators, will continue to grow at a double-digit pace.
Unlike permits, starts were down 3% (1.13 million units annualized) in August and, while the overall number was slightly below expectations, it was still a good report. The strength of the August starts data was in the single-family category, which is considered a far greater contributor to the overall economy. Single-family starts were down to 739,000 units (a 3% drop) in August, but this is simply a result of an 11% month-to-month surge in July.
A small monthly pullback was anticipated, but year-over-year single-family starts continue to look very strong. When averaged for three months, year-over-year growth in the single-family category stood at 15.3% in August, the fastest pace of growth since 2013. The overall starts number looks strong, as well, growing at a high-double-digit pace. With eight out of the 12 months behind us, starts average 1.09 million units so far. We've set our expectation for starts to be around 1.10 units in 2015, and it is very likely we will hit that goal by December. This would imply roughly 10% growth from a year ago, and we expect most housing indicators to converge on this growth rate by the end of the year.


Homebuilder sentiment reaches nine-year high (by Roland Czerniawski)
Builders appear to be bullish on the current state of the housing industry, as the homebuilding sentiment advanced 1 point from 61 to 62 in September, making this the highest reading since October 2005. The sentiment seems to be in line with the other housing indicators, especially in the single-family category, that have seen their growth revived this year. All three categories of present sales, future sales, and traffic of buyers appear to be at relatively high levels. We believe this report is yet another piece of evidence suggesting that the housing industry continues to recover. As we mentioned in our inflation report, though, builders are cheered by falling prices for some building materials, combined with stable-to-increasing selling prices for homes.
One big disappointment in the Fed's press conference this week was that Janet Yellen dismissed the relative importance of the housing industry to GDP growth. Housing isn't huge at 3% of GDP. However, if housing jumps 10%, which is our minimum expectation for all of 2015, that adds 0.3% to GDP growth. If it grows 20%, which is still possible, that adds 0.6%. In a world of 2% growth, that's still an important contributor, in our book. Housing has a lot of knock-on effects too, such as furniture, moving services, mortgage brokers, new phone lines, and cable service. It is a very important part of the U.S. growth story, one that Yellen mistakenly dismissed on Wednesday afternoon.
Manufacturing retreated some in August
Overall, July to August manufacturing-only industrial production fell 0.5% while the single-month, year-over-year growth rate fell to 0.9%. A big dip in auto production (that was clearly the result of a faulty seasonal adjustment factor on the production side of the house, as auto sales have been uniformly strong) was big driver of the industrial production decline. Without autos, industrial production would have been close to flat. However, our year-over-year averaged data, which removes some of the quirks, looked anemic at best, also.

By industry, there were a lot more down performances in August than July, but there were still a number of healthy categories, too. Non-metallic metals, machinery, and miscellaneous all did better than 1% growth month to month. Aerospace, autos, and fabricated metals were the big losers. There is no sign that the housing industry has come to rescue manufacturers just yet. We suspect that housing may push the manufacturing data up by year-end, but some of the hopes for any growth in fourth quarter to fourth quarter industrial product are diminishing. We believe that a strong consumer may offset some of the manufacturing weakness, which is at least partly export-driven and partly oil-driven.
More housing data, durable goods orders, world PMIs and final second-quarter GDP on tap next week
I may have indicated that housing is a key to our relatively optimistic second-half forecast. Year to date, existing-home sales are up about 20% while new homes are up a slower 8%. A demographic surge in the first-time homebuyer age cohort and a flattening in the 40-year-old cohort, which represents the bigger market for more expensive new homes, could explain why existing homes are doing better than new homes. In any case, both have are doing well. On the widely reported month-to-month headline numbers, things might even out a little bit in August.
A modest dip in pending home sales, an unexpected surge of new home sales in July, and fewer mortgage apps all suggest a modest dip in existing-home sales from 5.6 million to 5.4 million annualized units in August. However, year-over-year sales growth would still be a very healthy 20% or so. Meanwhile, new homes didn't have a wonderful July, but the increase in builder sentiment that we discussed above suggests that new home sales may accelerate to 520,000 units or so, above the July figure of 508,000 homes annualized.
The key manufacturing data point will be World PMI flash reading from Markit. With so much attention on China lately, this has become perhaps the single biggest market-moving data point each month, with only Fed pronouncements ranking as more important. The U.S. and European data have been converging to a slow but acceptable growth reading in the low 50s, while China's numbers keep falling and actually indicate an outright manufacturing decline. The China numbers in August may have been affected by a military holiday that shut down factories. In addition, housing data looks a little better for China, and the new iPhone buildup should have begun, hopefully pushing their poorly performing manufacturing economy back up. However, the all-important Chinese auto industry remains a question mark.
Finally, we will have the third and final reading on second-quarter GDP. The first reading was unusually low at 2.3% annualized, sequential growth and then that was revised by one of the largest amounts in history to 3.7%. The moving parts of the recent annual benchmark revisions and the regular adjustments along with the interaction of inventory and trade data make this revision nearly impossible to call. The consensus is for the third reading to be unchanged from the second at 3.7%. Our gut feeling is that a combination of prices, inventory factors, and trade leans more toward a slight reduction, perhaps to as low as 3.4%. However, that's really just a guess.


