Ian Tam: As stock investors continue to keep their eyes glued to the escalating trade war between U.S. and China, Canadian equities still seem to be showing a strong result in 2019 coming off a difficult Q4 of last year. Year-to-date the S&P/TSX Composite has produced a whopping 15.2% total return which may leave some value-oriented investors wondering if there are still bargains out there to be had. This week I use Morningstar CPMS to look for companies that are trading near or below their own historic valuations but have shown positive short-term growth in earnings.
So, in general, there are a few different ways to look for value companies when you are looking for stock picks. A very traditional way to do it is through a discounted cash flow model or a fair value model where you are going to be projecting earnings or cash flows out in the future discounting it back to present value and then applying a fair value to the stock and of course, if the stock is trading below that fair value, you have a value play in your hands. A couple of other ways include maybe valuing a company relative to other sectors – other peers in the sector. So, for example, if one bank is trading at a lower valuation than all the other banks in Canada, that could be a value play as well. But in a very cyclical market like Canada a very interesting way to approach this is maybe to compare a company’s valuation against its own history. And that’s what I am going to do today using Morningstar CPMS.
So, on the screen here I have a pie chart which hopefully viewers know by now is what make up my quantitative model. And this week what I am going to do is look for companies with a good combination of valuation metrics again that are close or lower than they have been in history when comparing against the same stock. So first looking at price to sales. So, price to sales is a very traditional value oriented metric comparing the price of the stock to its revenue generated per share and I want to see that that number is lower than the company's 10 year median price to sales metric. So, a company that’s trading below that would be rated higher in my model today.
In a very similar context, I am also looking at the forward price to earnings against the historical 10 year median price to earnings. In a very similar way, I am also looking at price to book. So, again, today's company's price to book versus that same company's median price to book over the last 10 years. Again, we're looking for companies that are very close or even below what they have been in the, in a very long period of time. To make sure these companies are sound or reasonably – show some reasonable quality I also look at the five year deviation of earnings per share. So, again, companies with very volatile earnings perhaps like a small cap mining company will have very high deviation of earnings, whereas a company like a bank which has very consistent earnings over time will have a low deviation of earnings over time and of course we are looking for low deviation of earnings here in my model.
And finally, just to make sure these companies are profitable I am looking for companies with a five year average ROE that’s high. So higher the better signifying that companies are returning value to their shareholders. So that's what makes up my model today and again for quantitative models built in Morningstar CPMS these factors determine the order in which stocks appear in my list. And for today's model I am using a universe of the what we call the CPMS 250 which is basically the largest 250 names in Canada by market flows.
So, the first step in our process is to take those 250 names and rank them based on these sets of fact – the set of factors here. In order for me to consider buying a stock the company has to be valued in the top 35% of that universe. I also want to make sure that those three historic valuation measures are somewhat close to one meaning they are trading at or hopefully below their historic valuations. I am also looking for ROE that’s generally positive and again just to make sure when I buy these companies, they are moving in the right direction I also want to make sure that the three month price change is positive.
Finally, I also want to make sure that companies are growing their earnings and for this week's model what I am using is quarterly earnings momentum. And again, that represents the last four quarters of operating earnings compared against the same number one quarter ago and of course I want that number to be positive.
So, in a nutshell what I am basically doing is looking for companies that are maybe a bit undervalued relative to their own history but are showing a positive short term earnings growth. And once I buy into a stock, I will only sell it if the stock's rank drops below the top 35% of my model or if any of the numbers turn negative in terms of ROE. So, if ROE turns negative, I will sell that stock. So that’s my model today and of course I will back test this for you using Morningstar CPMS.
So, I have started my back test back in May of 1992 and using the information available at that point in time I would approach as the best 15 stocks that met my requirements again using the information at the point in time. Just to make sure that I am not overly focused or overly exposed to one economic sector. I have ensured to have a maximum of four stocks per economic sector. So, you'll see here what’s happening is we started with those 15 stocks at the end of each subsequent month if any of the stocks show a negative ROE or if they drop in rank in terms of valuations, I sell those stocks and replace it with the next highest ranking stock. We're just repeating that algorithm over and over again in this case for the last 20 plus years or so.
So just a comment here as we are back testing for those of us that remember the dotcom or the tech bubble. It would make sense that our model would have underperformed when dotcom type companies or tech companies at that point in time were doing really well simply because those companies maybe not always, were not always profitable. So, ROE as a metric will ensure that we don’t get involved in those types of companies in addition many of those companies at the time were trading much higher than their historic valuations and of course those stocks wouldn’t have been considered. So, on the upside we missed, or we did better than the market in the dotcom bubble, in the downside we didn’t participate as much during that same time period.
Okay. So, let's have a look at that back tested result. I didn’t put any fees or management fees in this or transaction cost in this back test. So please keep that in mind as we look through these results. So over that time period from May 1992 to April 2019 this strategy returned an annualized return of 10.4% which is about 1.8% better than the S&P/TSX Composite my benchmark today. The turnover on this model is about 50% meaning on average you are trading maybe 1, 2 times a quarter so in quant we are older in rules based investing that would be fairly low turnover model. And more importantly the Sharpe ratios of 0.6 when you compare that to the S&P/TSX Composite the Sharpe ratio is 0.4 there. So, we are getting a bit more, bit higher risk adjusted return rather than simply buying an index. So, we are a bit more risk efficient on the index.
Looking a bit deeper into this I also want to show you that in down markets and on the quarters in the last 25 years where the TSX was down our strategy beat the benchmark about 74% of the time. And in all the quarters where the market was up our strategy beat the market about 51% of the time. So, certainly, more of a defensive style model when we are looking at value names here.

- source: Morningstar CPMS
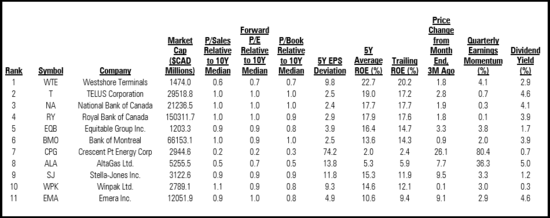
So, the top ranked stock in the strategy today is Westshore Terminals. Westshore operates a cold storage and loading terminal at Roberts Bank, British Columbia and revenues derived from rates charged for loading coal onto sea going vessels. The company serves coal mines in British Columbia, Alberta and the North Western United States. The other companies that qualify to meet my strategy today will be listed in the transcript attached to this article.
From Morningstar, Ian Tam.


