In a handful of articles and a landscape report written by my colleagues, Morningstar touts the fact that in investing, diversification is the only free lunch. What does this mean and what’s free about it?
First, let’s understand what it means to be diversified.
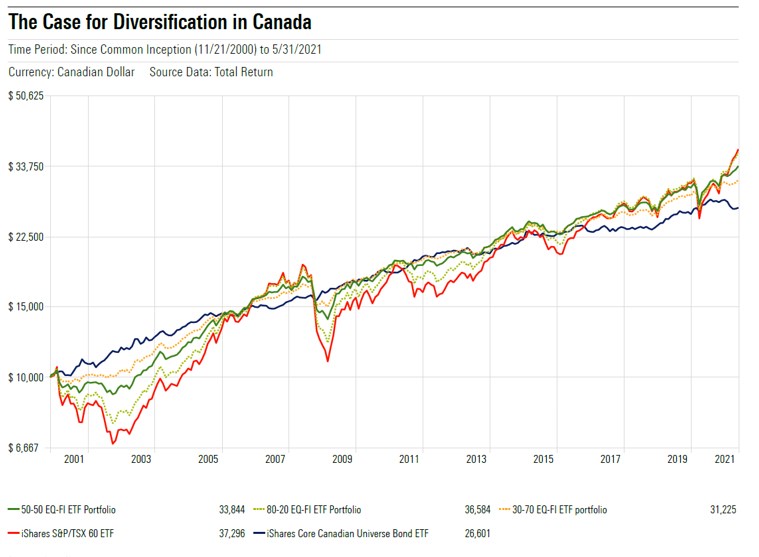
Source: Morningstar Direct
The above chart illustrates the performance of two well-known ETFs: the iShares S&P/TSX 60 ETF and the iShares Core Canadian Universe Bond ETF - meant to represent portfolios of large cap Canadian stocks and bonds. Also displayed are various combinations of the two ETFs, re-balanced on a quarterly basis. As one might guess, having a portfolio consisting of the two ETFs will land you results that are somewhere in between the returns of stocks and bonds over the last 20 years or so.
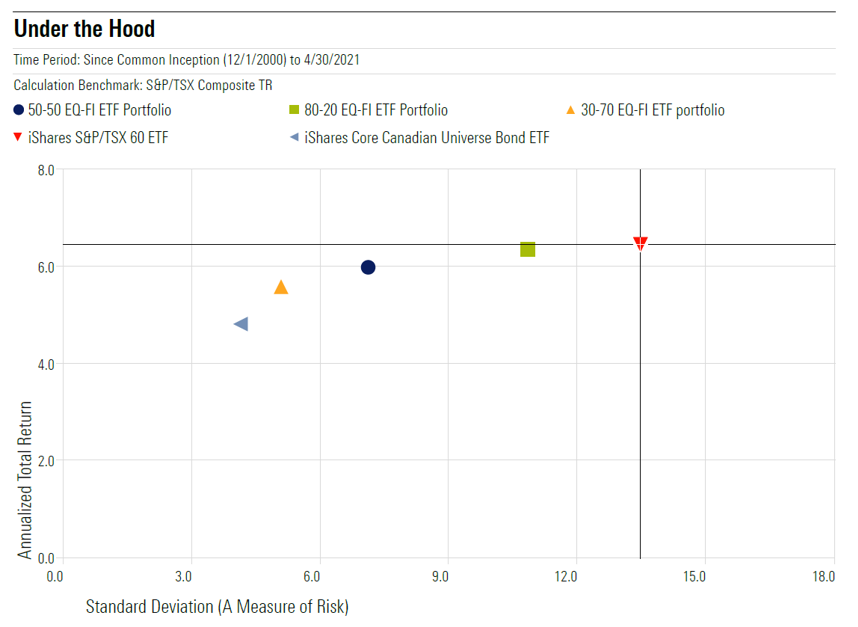
Source: Morningstar Direct
That said, it’s important look not just at returns, but the amount of risk that you are taking on for being invested. In the above graph, we plot risk on the horizontal axis by measuring the volatility of each of the return streams (a measure known as standard deviation, lower is better). We plot annualized returns on the vertical axis. Compared to the S&P/TSX 60, each other portfolio of stocks/bonds is indeed getting lower returns, but by taking less risk. Investors call this concept a risk-adjusted return, and it can be quantified in many ways. The most popular is known as the Sharpe ratio which is the return of an investment divided by the standard deviation of returns. This tells an investor how much return they are getting per unit of risk.
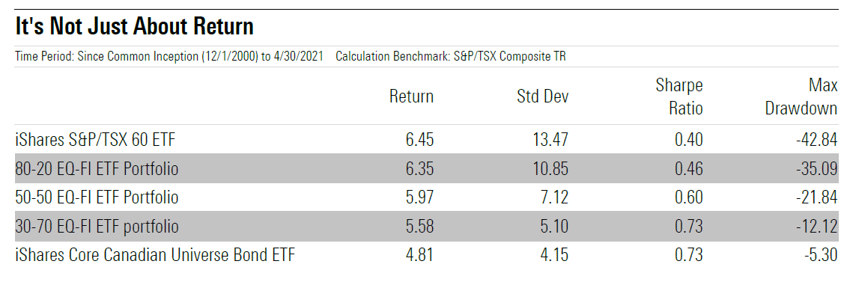
Source: Morningstar Direct
By investing in just two asset classes, we get a higher risk-adjusted return. For example, investing in the TSX 60 by itself affords you a 6.45% annualized return with a Sharpe Ratio of 0.4. Meanwhile, investing in a 50/50 portfolio produces a 5.97% return, but with a Sharpe Ratio of 0.6, which implies that you would have been getting higher returns, per unit of risk – simply by being diversified across two asset classes. Not a bad deal for simply buying two ETFs instead of one. This also holds true when you look at the measure of maximum drawdown. As a reminder, maximum drawdown is the percentage lost from peak to trough during a market correction. An investor holding just stocks would have lost 43% during the crisis, while a 50-50 portfolio would have lost 22%.
So, Where’s the Free Part?
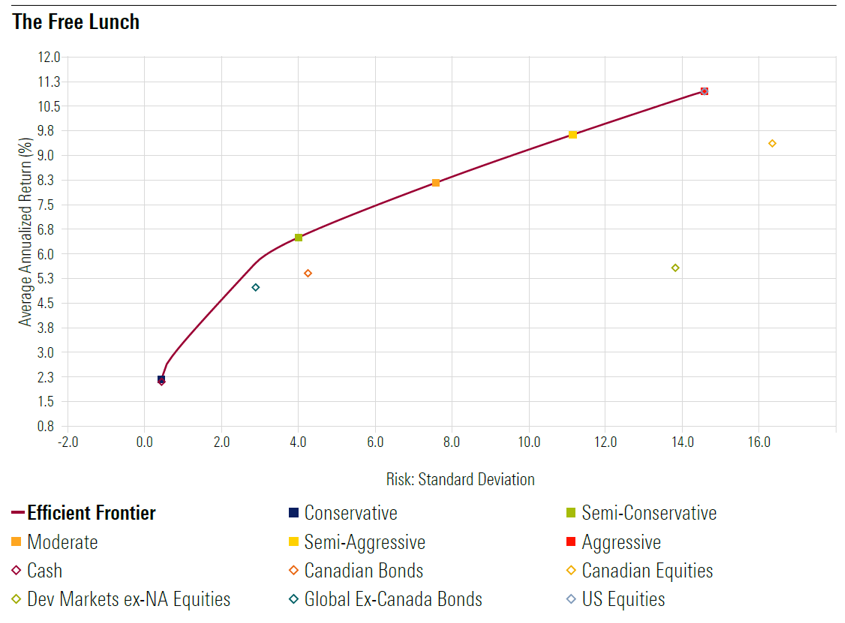
In reality, most investors will have more than just two investments. The below chart illustrates this again by plotting the returns of various asset classes (represented by Morningstar’s Category Benchmark indices) on the vertical axis against their historical risk on the horizontal axis:
Source: Morningstar Direct
There’s also a curved line on the chart. This line represents all the possible combinations of portfolios that are created using the individual asset classes such that we maximize return, per unit of risk. This line is duly named the “efficient frontier,” a term introduced by Nobel laureate Harry Markowitz in 1952. I’ve also outlined a few points on that line that illustrate what those combinations look like:

Source: Morningstar Direct
For example, the dot on the far left, labelled “Conservative,” illustrates a portfolio that holds mostly cash. The dot labelled “Moderate” is a portfolio with a mix of both stocks and bonds.
Notice that all the points on the efficient frontier are above the individual asset classes. What this means is that in most cases, there is a portfolio out there that consists of a mixture of asset classes which has afforded an investor a higher return for the same amount of risk, when compared to an asset class on a standalone basis. In other words, it pays to be diversified – and it doesn’t cost you anything except buying a variety of asset classes. Now that’s a good deal!
Here’s the Catch
There’s always a catch. For diversification to work, we must invest in asset classes that have low correlation to other part of the portfolio. Correlation measures the degree to which two investments move in tandem with one another. Ideally, we want the different asset classes in our portfolio to have low correlations with one another to get the best bang for our buck. To help with this, the below correlation matrices show correlations of major asset classes, largely represented by Canadian mutual fund categories.
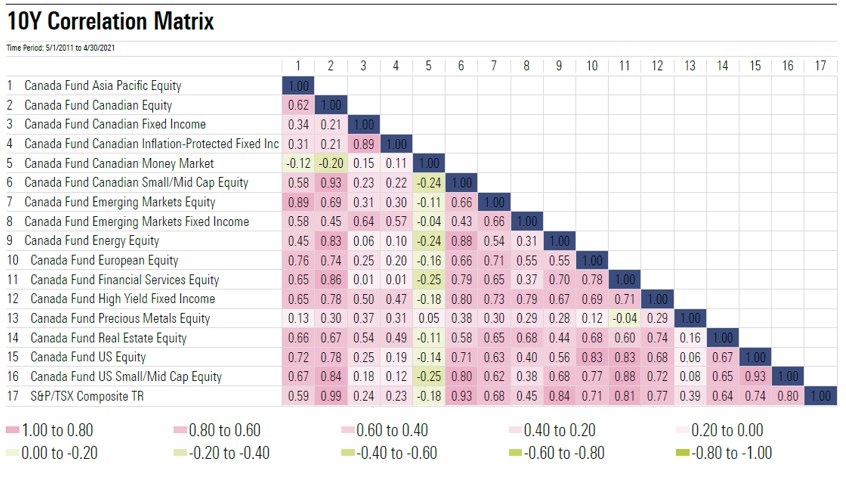
Looking down the second column, we can see that the category of Canadian equity mutual funds has on average showed a 0.21 correlation to Canadian fixed income funds, and a 0.78 correlation to the US equity markets. Also notice that looking down the fifth column, many asset classes are negatively correlated to Canadian money market category, often used as a proxy for cash in by professional managers. It would serve an investor well to have a sense of what asset classes are correlated to one another when deciding up on an overall asset allocation.
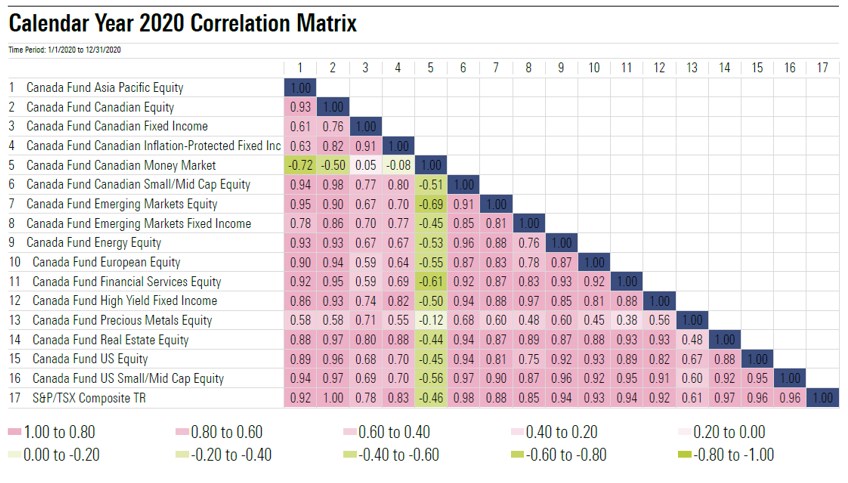
There’s another catch – the above matrix measures correlations over a relatively long period of time (10 years). Correlations will change over time, and moreover can often increase during times of market panic. Case in point, here is the same matrix calculated over the 2020 calendar year, which encompasses the pandemic sell-off and subsequent recovery.
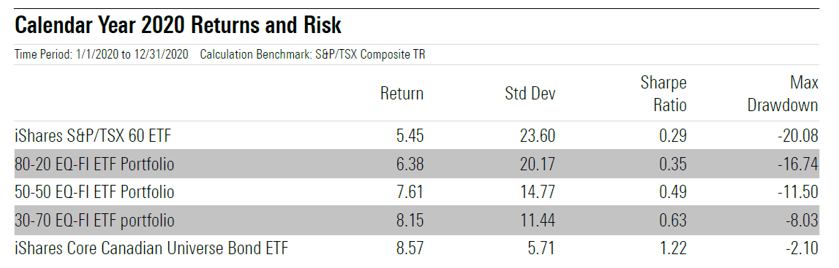
Nevertheless, being appropriately diversified and allocated (per your risk tolerance and risk capacity) to stocks and bonds would have afforded better results over the most recent market panic, as depicted below.
This article does not constitute financial advice. It is always recommended to speak with a financial advisor or investment professional before investing.