Last Tuesday’s column tracked the fortunes of the largest U.S.-listed stocks in December 1986, as measured by market cap (we did a similar analysis of Canadian stocks yesterday).
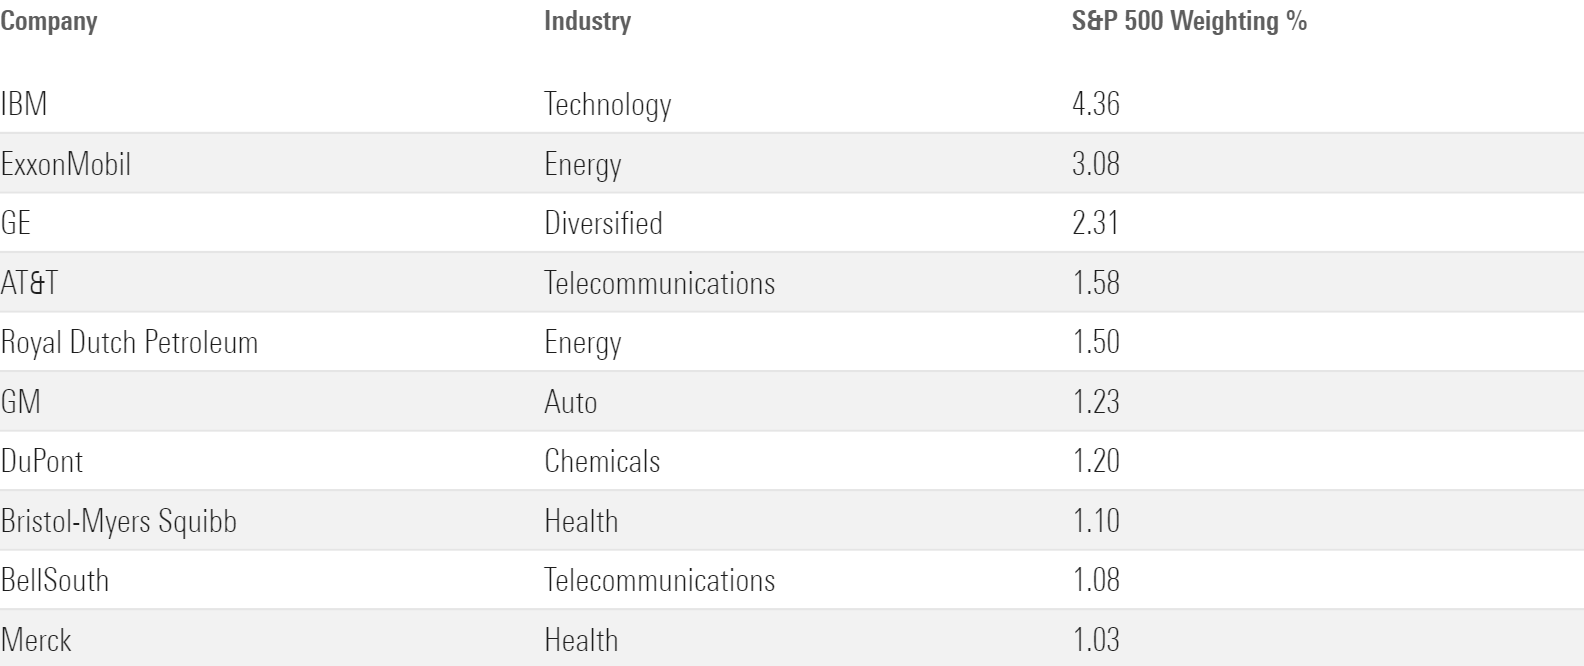
Thirty-six years later, only one of these U.S.-listed companies remained among the S&P 500′s top 10 holdings. (Can you guess which? The answer follows shortly.)
The fates of the others ranged from the relatively successful outcome for Merck [MRK], which now possesses the index’s 21st slot, to the dire fate suffered by General Motors [GM], which bankrupted its shareholders in 2009.
Here is the current list.
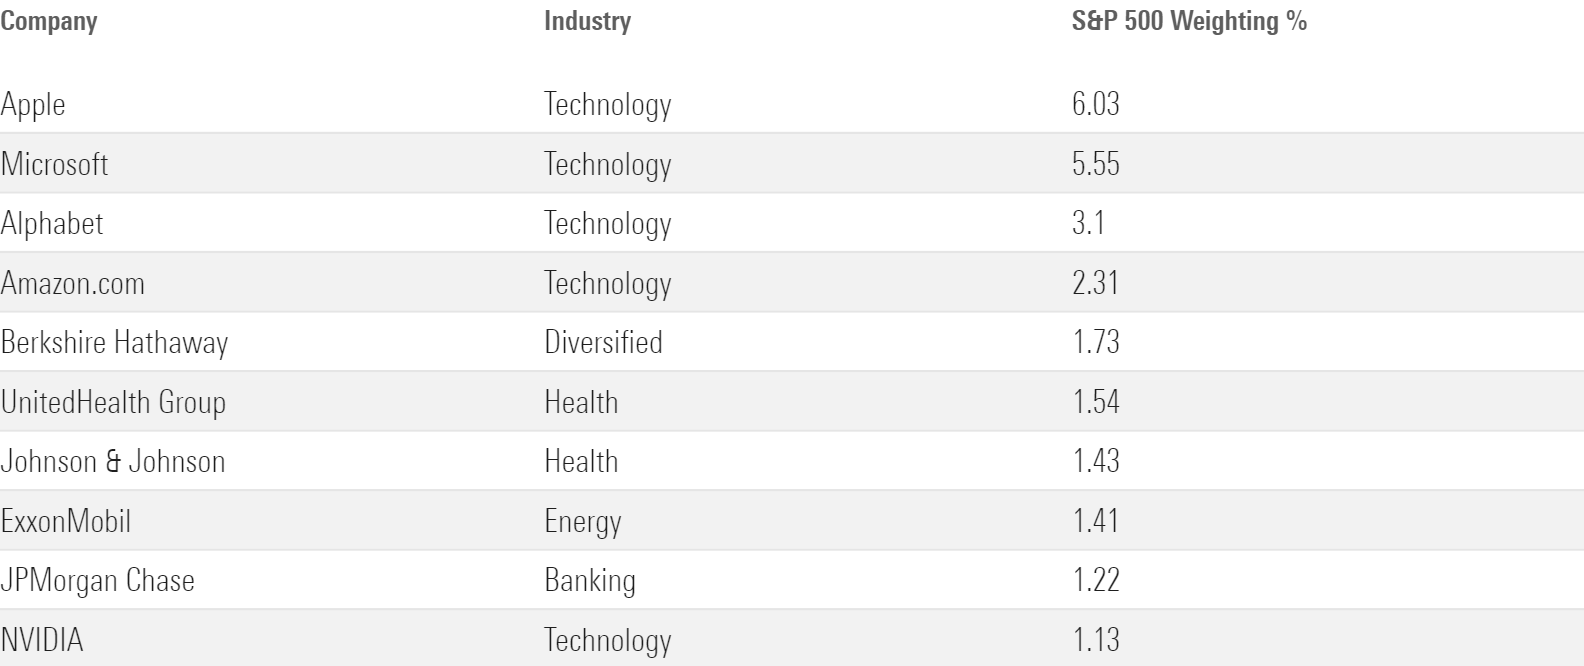
The answer to the above question is ExxonMobil [XOM]. Its shares were only the second-highest performer from 1987 through 2022 (behind those of Merck) but because ExxonMobil was three times the size of Merck, its cushion permitted it to remain on the leaderboard.
The newcomers have a mixed heritage. Two were large corporations that became even larger; another four were smaller businesses that were on the rise; and three had not yet been born when 1986 concluded.
Bigger Than Ever
Today’s list is headed by Apple [AAPL] and Microsoft [MSFT], which make up one eighth of the S&P 500. Their combined weight is 60% greater than what IBM IBM and ExxonMobil possessed in 1986, when they were the index’s two largest positions.
That trend continues through the rest of the current top 10 list, as every position has a larger weighting than its 1986 counterpart. The rich have become richer.
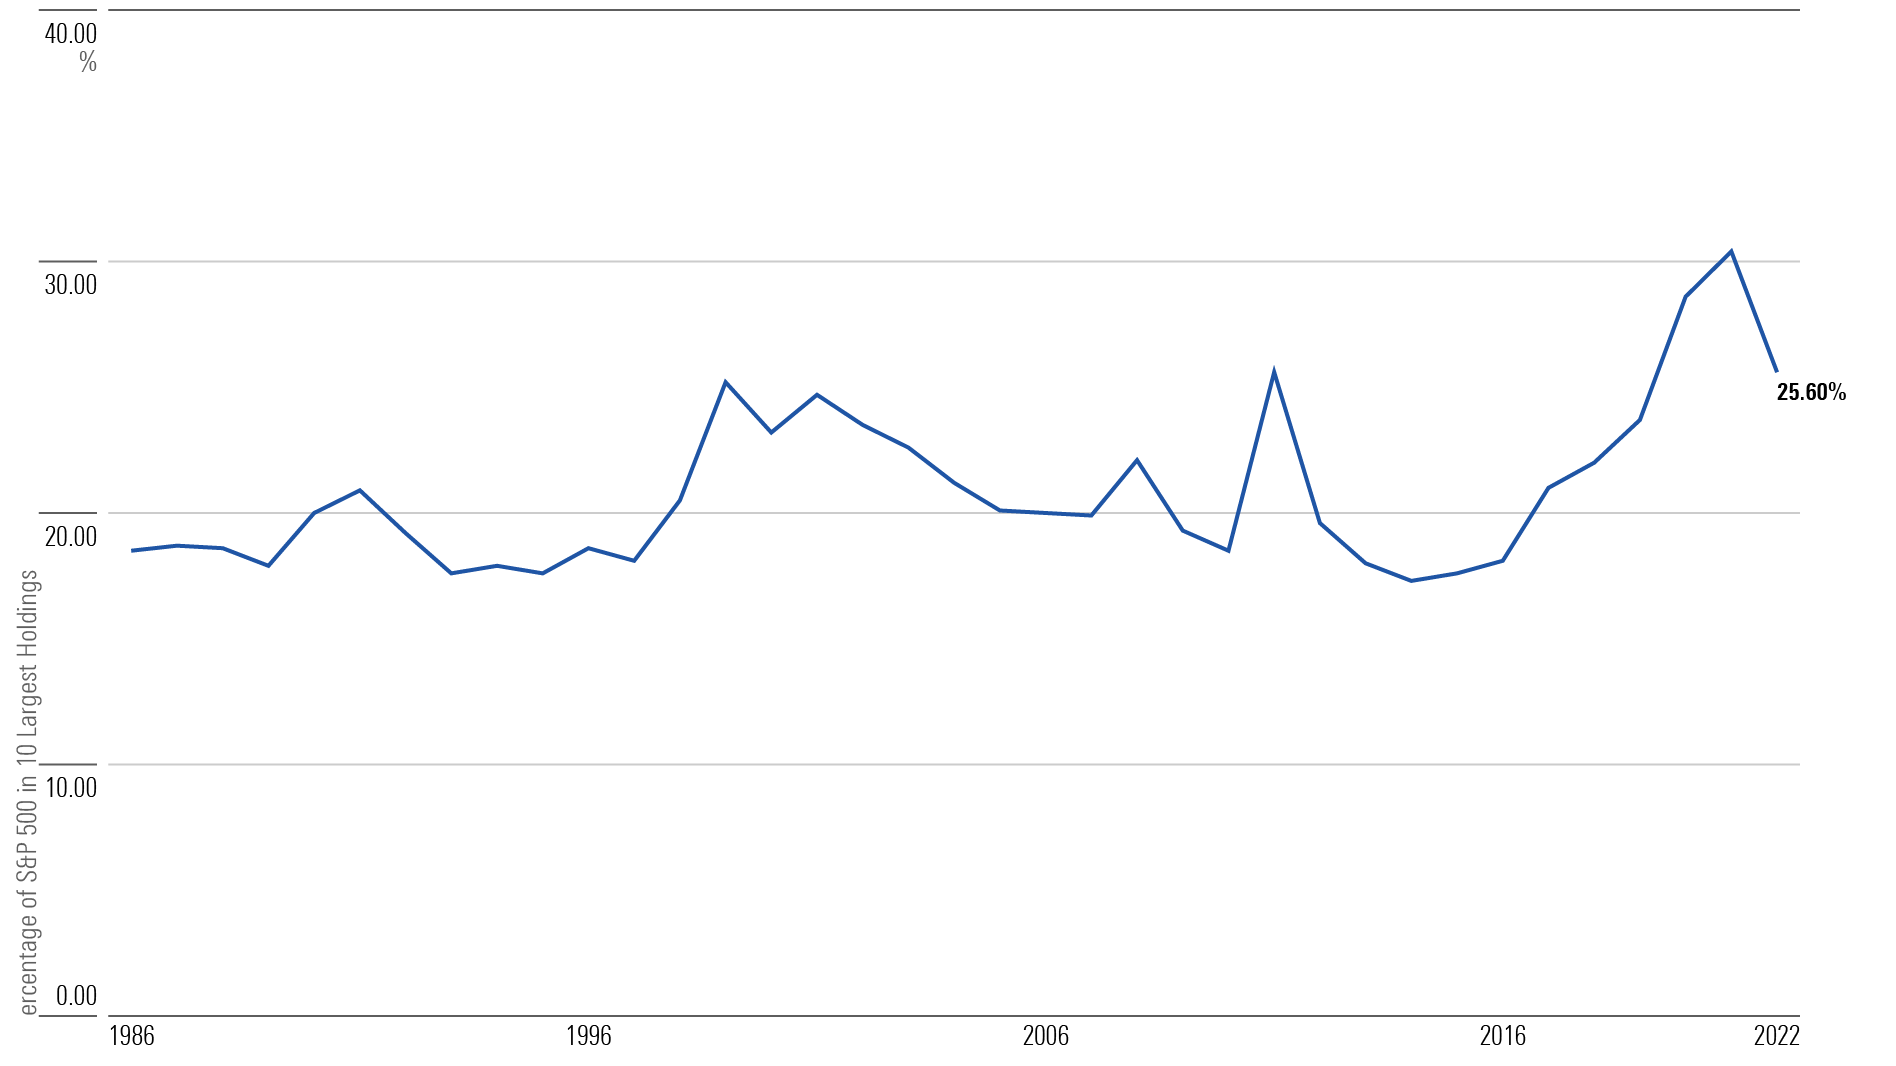
Until the late 1990s, the share of market cap for the S&P 500′s 10 largest companies hovered near 18%. It then spiked to 25% by December 1999, before subsiding over the next 15 years to its previous level. Recently, it has increased again, hitting record highs.
Technology’s Rise
The explanation for that pattern is no mystery. The surges in the top 10′s market share coincide with two great booms in U.S. growth stocks. The first occurred in the mid- to late 1990s, peaking in March 2000. The second is recent history. Growth companies sharply outgained their value-stock counterparts from 2017 until late 2021.
Growth stocks thrive when the marketplace is optimistic. During such times, investors collectively shed their concern that the biggest companies have nowhere to go but down.
Their deepest conviction that the strong will become stronger was in 2021, when the four companies of Apple, Microsoft, Alphabet [GOOGL], and Amazon.com [AMZN] made up almost 21% of the S&P 500 all by themselves.
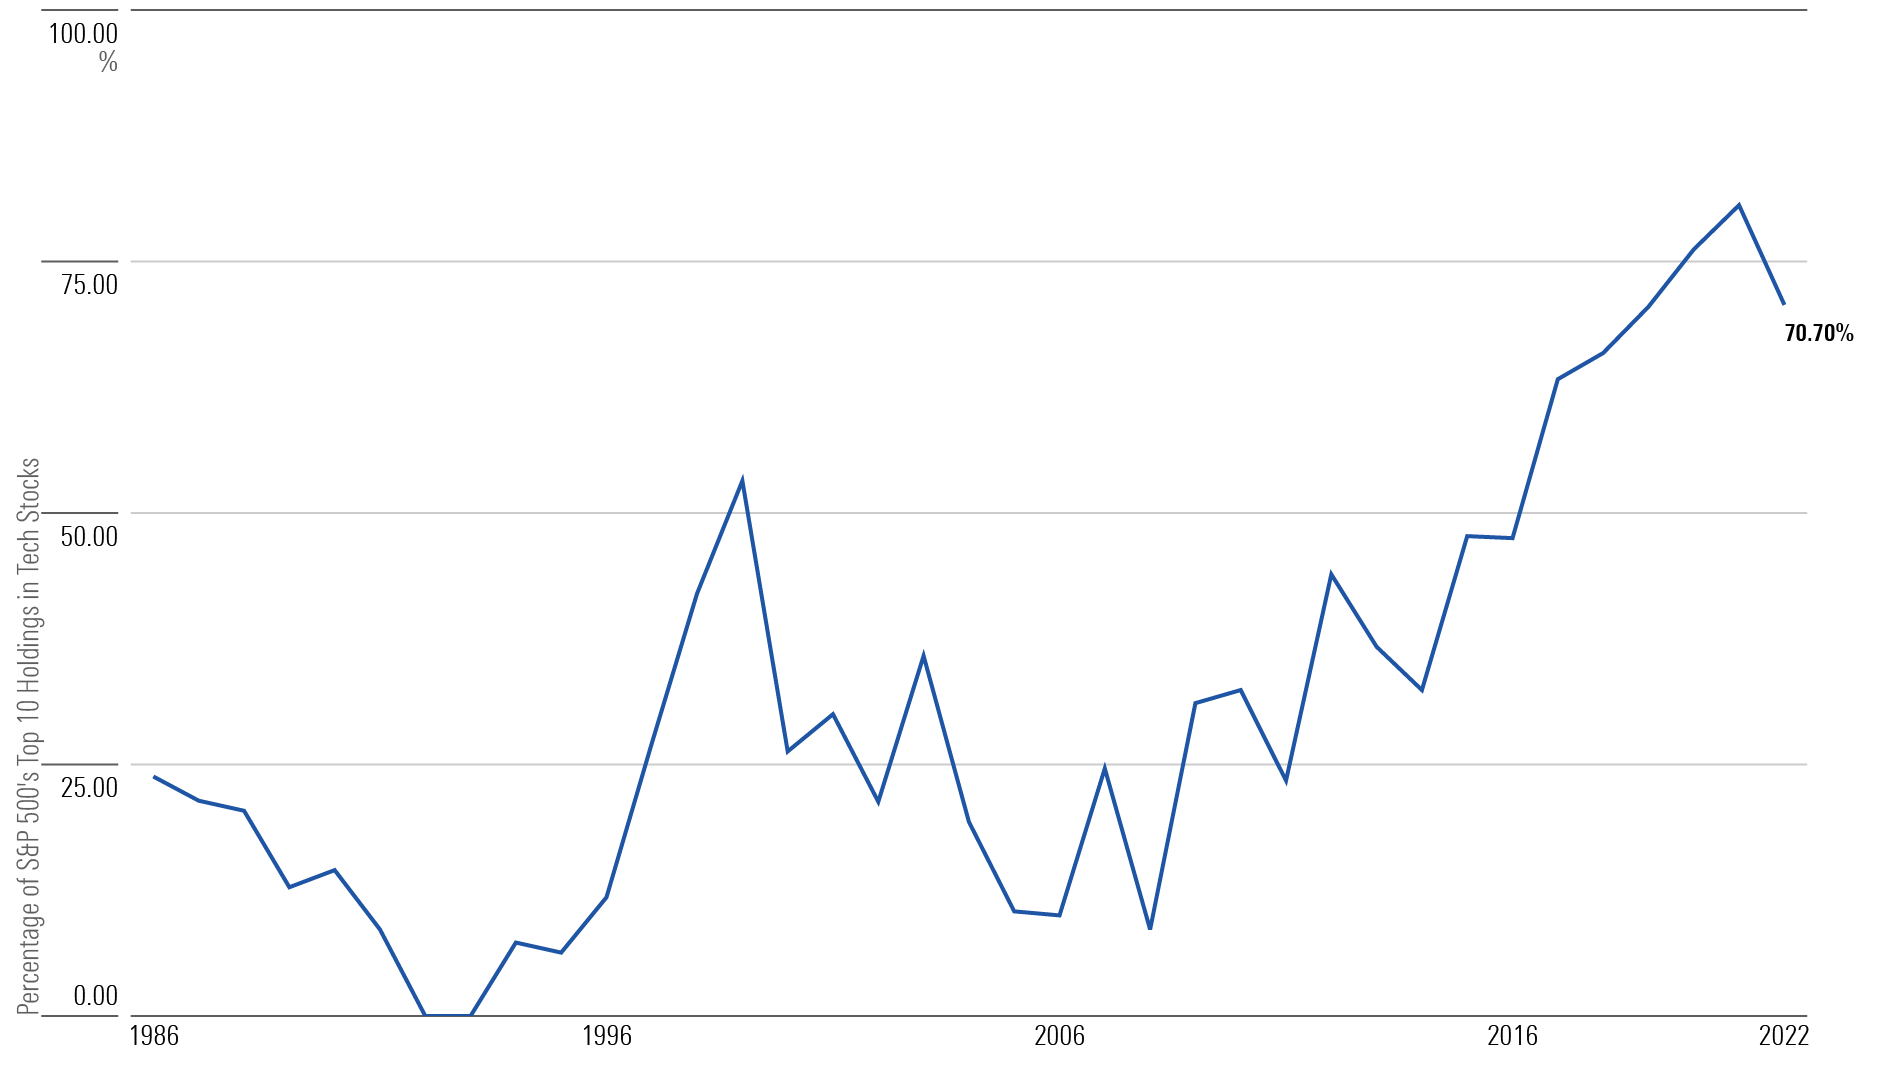
Those businesses, of course, all engage in technology. This leads to the second great shift in the index’s top holdings: the ascension of technology stocks. In 1986, IBM was the only tech company to crack the top 10, accounting for 25% of that group’s portfolio weight.
Today, the tech sector harbors more than 70% of the index’s top 10 assets. (Officially, Morningstar categorises Amazon as a consumer goods business, but for the purpose of this column I have placed it in Technology because its stock tends to trade with that industry.)
Such evidence would seem to support the common contention that the S&P 500, along with the other broad-based U.S. stock market indexes (and even to some extent global equity indexes, given that American stocks make up more than half the world’s total), has become a growth-stock proxy. So, I tested the proposition.
Rolling Correlations
I did so by comparing the monthly total returns for the S&P 500 against those of the Morningstar US Growth and Morningstar U.S. Value indexes. (I used Morningstar benchmarks to give the evaluation an independent view of the investment styles.)
Beginning in June 2000, the earliest date for which the Morningstar figures were available, I measured each comparison’s correlation over the trailing 36 months. The results are below.
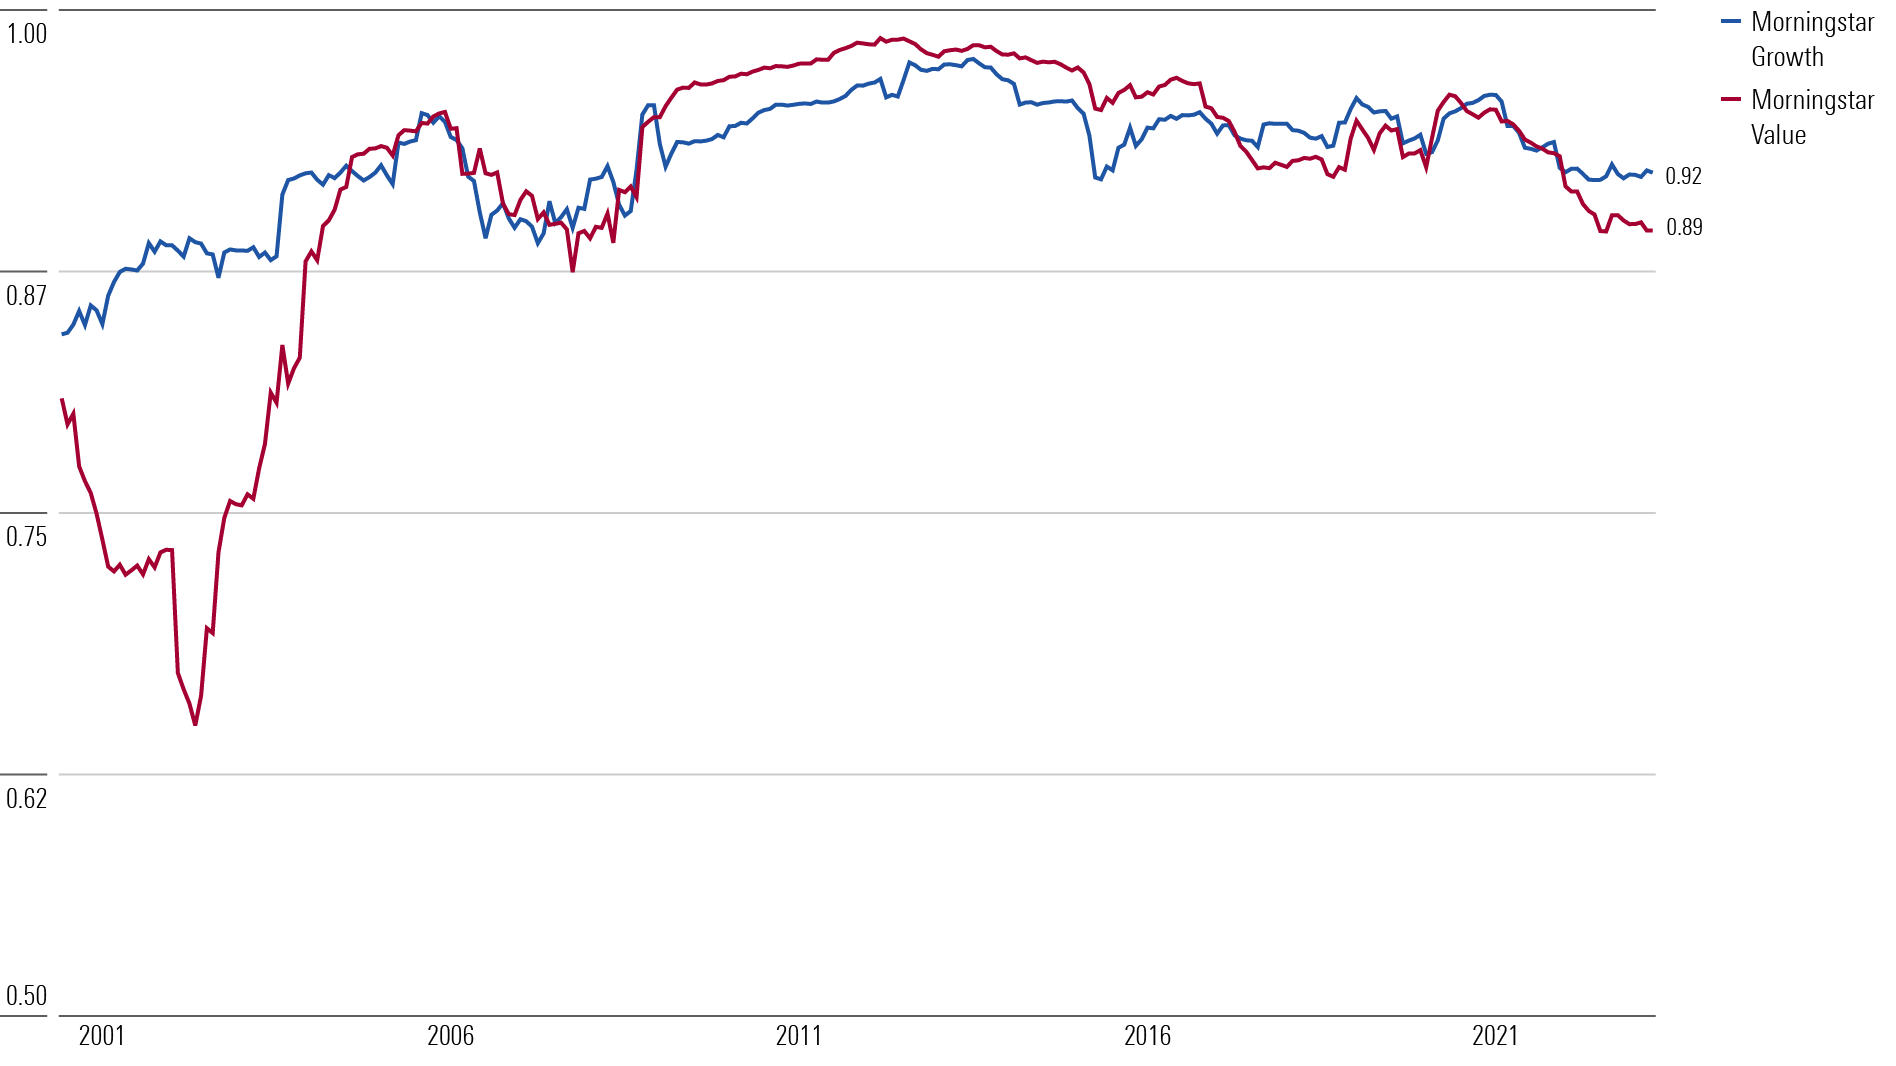
The chart depicts three distinct states. At the beginning of the period (for clarification, the dates on the graph represent the conclusion of the 36-month periods, rather than the onset), the S&P 500 was visibly more correlated with growth stocks than with value stocks. I do not remember whether index fund critics in the late 1990s carped about the S&P 500 being a growth-stock fund in disguise, but if so, their complaint was valid.
That behaviour reflected the extreme and unusual divergence between the two investment styles during the late 1990s and early 2000s, when growth stocks frequently rose while value stocks fell, or vice versa. A few years into the 2000s, however, growth and value began to trade in tandem. All was one.
In recent years, the investment styles have once again diverged. However, the effect of that separation has been muted, as both styles continue to show a relatively high correlation with the S&P 500. Consequently, it would be almost as accurate to state that the S&P 500 has become a value-stock index than it is to argue that it trades like a growth-stock index. Each claim would be a half-truth.
Conclusion
As it turns out, the biggest U.S. stocks are not representative of the huddled masses.
Although the tech sector dominates the 10 largest positions in the S&P 500, it accounts for only about 12% of the remainder. The top of the stock market pyramid is overloaded with growth companies. However, those characteristics are counterbalanced by the rest of the index’s holdings, most of which are value stocks.
In short, despite what may appear to be convincing evidence, S&P 500 index funds have not really become growth stock funds. Their largest positions are, but not the portfolio overall.


