This month marks five years since the covid market downturn.
Though the initial downturn on March 9, 2020, was dramatic—the US stock market lost nearly 8% in one day—the US stock market ultimately recovered from that crash in just four months, making it the fastest recovery of any market crash over the past 150 years.
Not even two years later, the stock market experienced a worse downturn: The market took 4 times as long (18 months) to recover from the crash of December 2021, spurred by the Russia-Ukraine war, intense inflation, and supply shortages.
So, with these recent market crashes behind us, what have we learned?
1. It’s impossible to predict how long a stock market recovery will take.
2. If you don’t panic and sell your stock holdings when the market crashes, you will be rewarded in the long run.
The covid crash and the Ukraine/inflation downturn may be the freshest memories, but these lessons also ring true when it comes to all other historical market crashes: Though they had varying lengths and levels of severity, the market always recovered and went on to new highs.
Here’s what we’ve learned from the market declines of the past 150 years.
How Frequent Are Market Crashes?
The number of market crashes depends on how far back we go in history and how we identify them.
Here, we turn to data that former Morningstar Director of Research Paul Kaplan compiled for the book Insights into the Global Financial Crisis. Kaplan’s data includes monthly US stock market returns going back to January 1886 and annual returns over the period from 1871-1885.
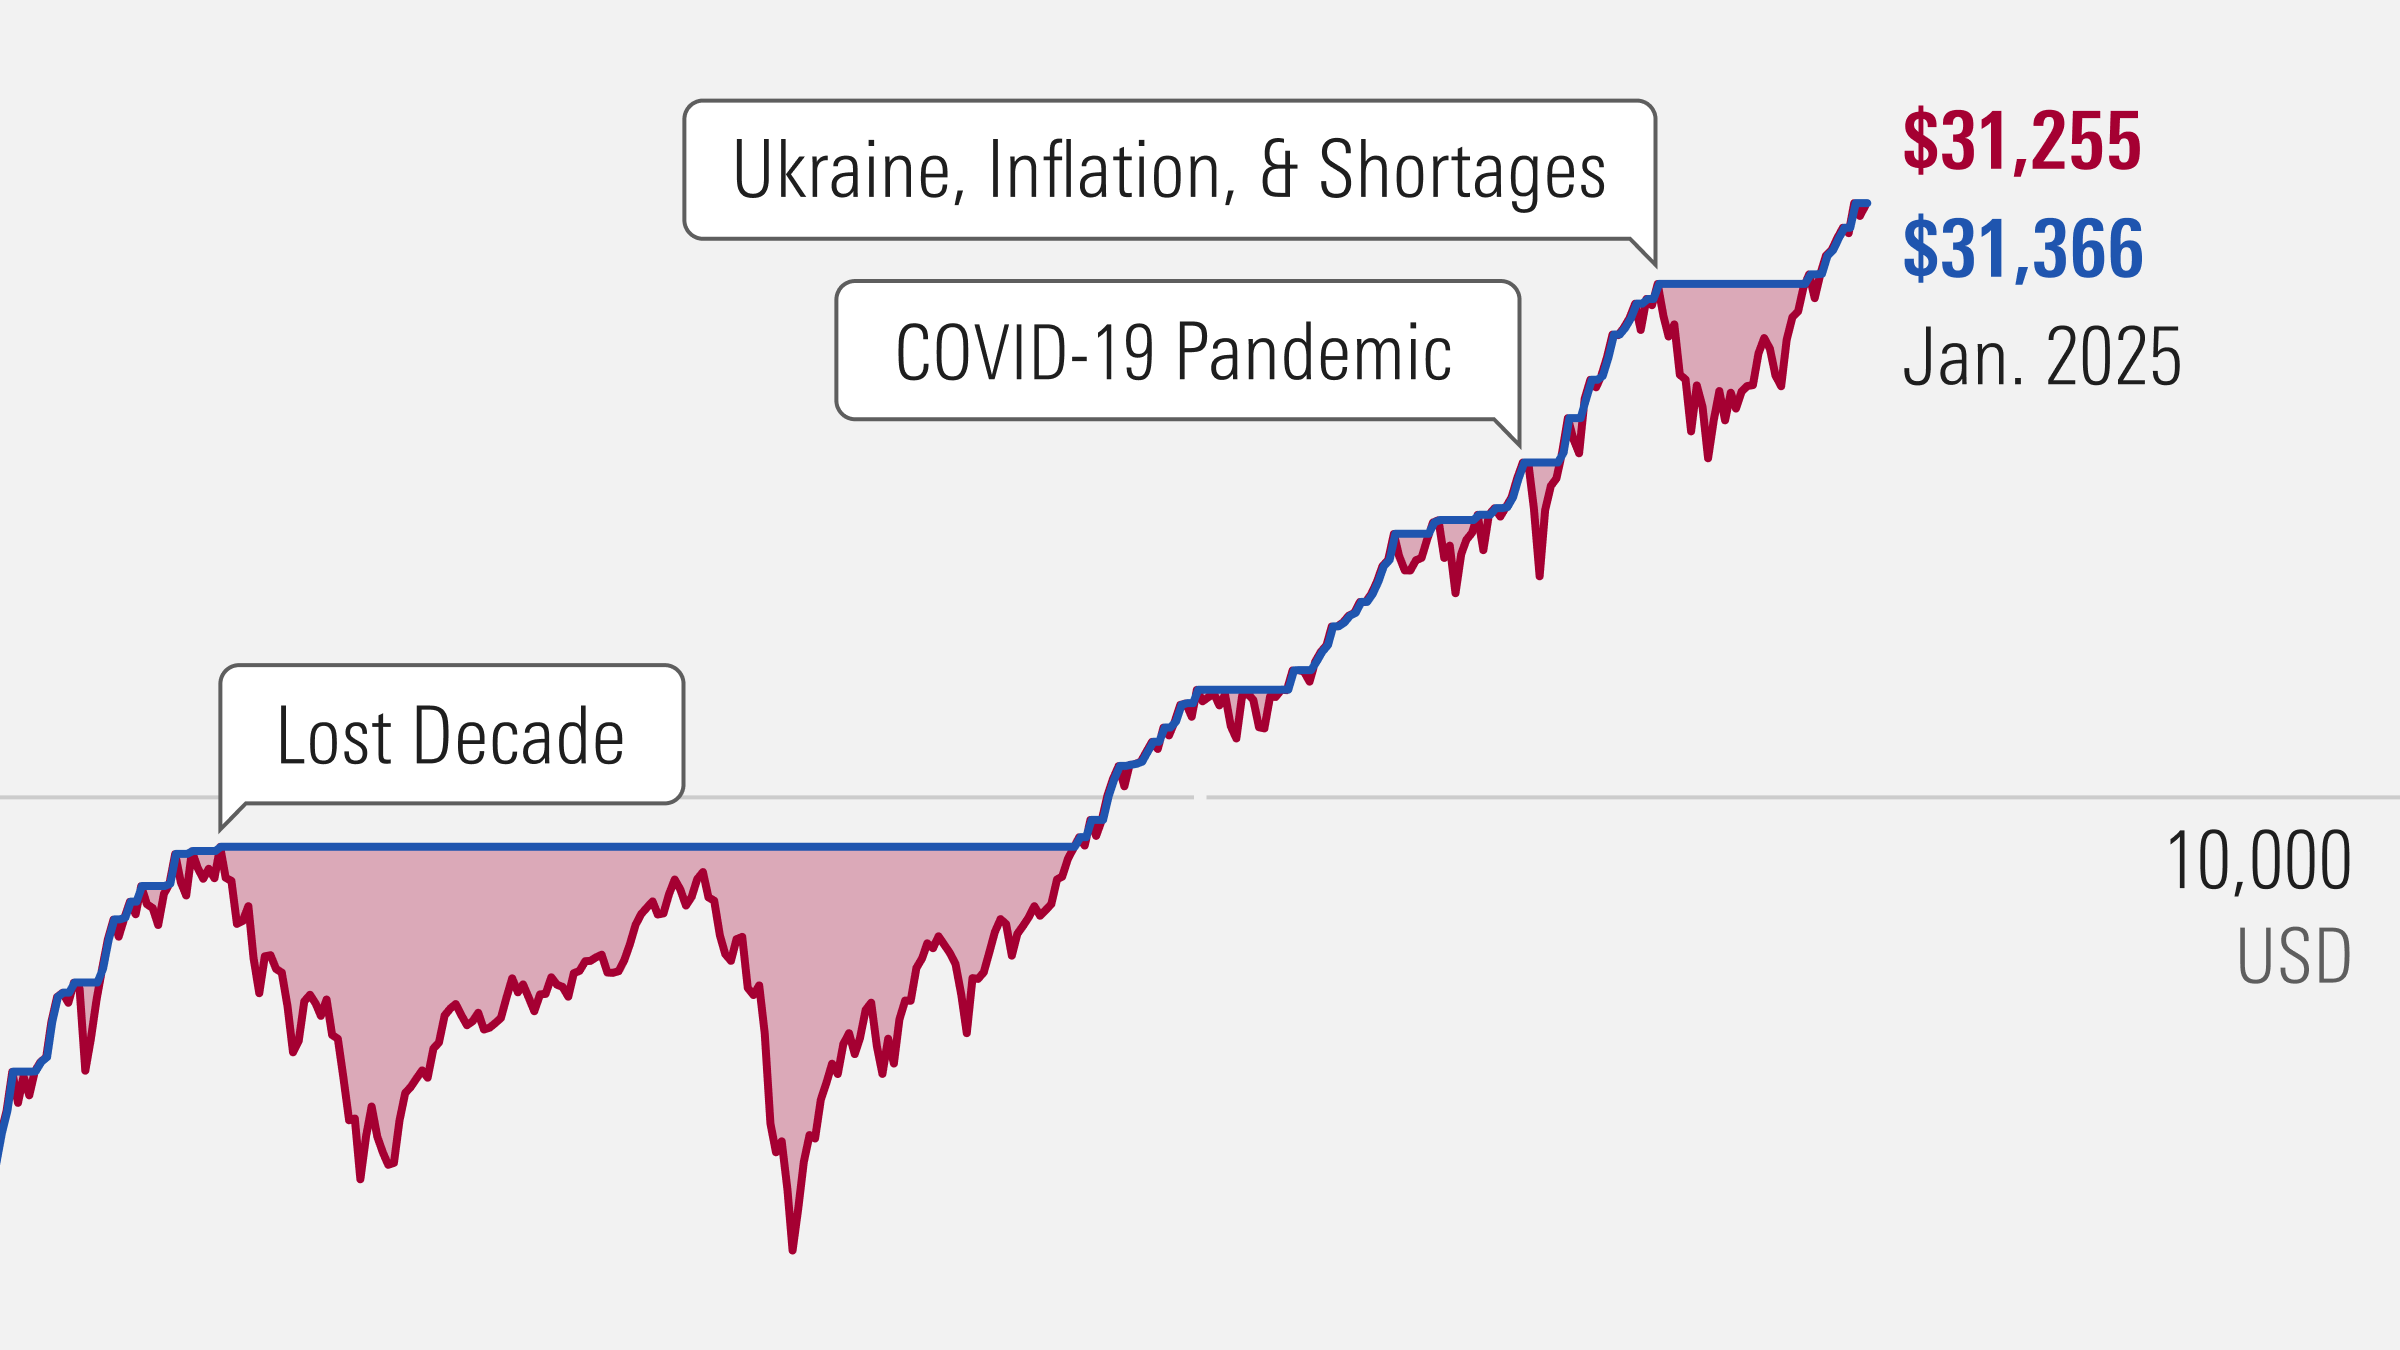
In the chart below, each bear-market episode is indicated with a horizontal line, which starts at the episode’s peak cumulative value and ends when the cumulative value recovers to the previous peak. (Note that we use the term “market crash” interchangeably with bear market, which is generally defined as a decline of 20% or more.)
When you incorporate the effect of inflation, one dollar (in 1870 US dollars) invested in a hypothetical US stock market index in 1871 would have grown to $31,255 by the end of January 2025.
The substantial growth of that $1 highlights the enormous benefits of staying invested for the long term.
Still, it was far from a steady increase over that period. There were 19 market crashes along the way, with varying levels of severity. Some of the most severe market crashes have included:
The Great Depression, which began with the crash of 1929. This 79% stock market loss was the worst drop of the past 150 years.
The Lost Decade, which included both the dot-com bubble burst and the Great Recession. Though the market began recovering after the dot-com bubble burst, it didn’t climb back to its previous level before the crash of 2007-09. It didn’t reach that level until May 2013—more than 12 years after the initial crash. This period, the second-worst drop of the past 150 years, ultimately included a stock market loss of 54%.
Inflation, Vietnam, and Watergate, which began in early 1973 and ultimately led to a stock market decline of 51.9%. Factors that contributed to this bear market include civil unrest related to the war in Vietnam and the Watergate scandal, in addition to high inflation from the OPEC oil embargo. This market downturn is particularly relevant to today’s environment, given issues like the recent inflation surge and the Russia-Ukraine and Israel-Hamas wars.
These examples demonstrate the frequency of market crashes. Though these events are significant at the moment, they are indeed regularly occurring events that happen approximately once a decade.
How to Measure the Pain of a Market Crash
How do you evaluate a market crash’s severity? That’s what Kaplan’s “pain index” measures. This framework considers both the degree of the decline and how long it took to get back to the prior level of cumulative value.
Here’s how it works: The pain index is the ratio of the area between the cumulative value line and the peak-to-recovery line, compared with that area for the worst market decline since 1870. That is, the crash of 1929/first part of the Great Depression has a pain index of 100%, and the other market crashes’ percentages represent how closely they matched that level of severity.
For example, consider that the market suffered a 22.8% drop around the Cuban missile crisis. The crash of 1929 led to a 79% drop, which is 3.5 times greater. That’s already significant, but also consider that the market took four and a half years to recover after that trough, while it took less than a year to recover after the trough of the Cuban missile crisis. So, taking this time frame into account, the pain index conveys that the first part of the Great Depression was 28.2 times worse than the Cuban missile crisis downturn.
The table below lists the bear markets of the past 150 years, sorted by the severity of market decline, and including its pain index.
As you can see, the market downturn of December 2021 (resulting from the Russia-Ukraine war, intense inflation, and supply shortages) ranks 11th on this list. By comparing this market crash to the other ones on the table, we see that the 28.5% stock market decline over that nine-month period was more painful for the stock market than the Cuban missile crisis and several downturns of the late 1800s/early 1900s.
And the covid crash of March 2020 was actually the least painful of these 19 crashes, due to the quick subsequent recovery. Though the downturn was sharp and severe (a 19.6% decline over roughly a month), the stock market ultimately recovered to its previous level a mere four months later.
5 Most Severe Market Crashes of the Past 150 Years
To better evaluate the impact of some of the most severe downturns of the past 150 years, let’s follow the path of $100 at the beginning of each market crash.
World War I and Influenza. After peaking in June 1911, markets soon started falling due to the breakups of conglomerates like the Standard Oil Company and the American Tobacco Company—and the worst part of this downturn began when World War I broke out in July 1914. The stock market continued to decline over the next few years (bringing that $100 investment down to a value of $49.04) and didn’t recover until after the 1918 influenza pandemic.
1929 Crash and Great Depression. If you invested $100 in the stock market at the time of the 1929 crash, it would have declined in value to $21 by May 1932. This crash occurred when the post-World War I economic boom (which led to overconfidence, overspending, and overinflation of prices) was eventually no longer sustainable—a downturn from which the market took more than four years to recover.
Great Depression and World War II. The recovery from the first part of the Great Depression didn’t last long. Though the stock market recovered to its 1929 high by November 1936 (meaning that our investment had recovered to its $100 value, and even slightly ticked up to $100.23), it started declining again in February 1937. This next decline was largely owed to President Franklin Roosevelt’s changes in fiscal policy, including factors like the contraction in banks’ reserve levels and the Social Security tax, which compounded with the impact of World War II. The investment sank to $52.49 in March 1938, and eventually recovered to $104.88 by February 1945.
Inflation, Vietnam, and Watergate. In 1973, Middle Eastern members of OPEC imposed an oil embargo on the US, which led to severe inflation. On top of turmoil around the withdrawal of troops from Vietnam and political uncertainty after the Watergate scandal, this period saw a 51.9% stock market decline—which would have brought a $100 investment down to $48.13. It took more than nine years to recover from this downturn.
Lost Decade (Dot-Com Bust and Global Financial Crisis). The dot-com bust began when overinflated prices in Internet and technology companies hit a breaking point, losing nearly all the gains they had previously made. A $100 investment in August 2000 would have declined in value to $52.76. Seven years later, the stock market had almost gotten back to its previous level ($95.25) when the housing bubble burst and mortgage-backed securities began experiencing losses, leading to the Great Recession (in which the investment declined in value to $46). Altogether, this 12-year period included a 54% decline.
The market ultimately recovered from the Great Recession in May 2013, but still to come was the covid market crash and the downturn of late 2021.
There were also several shorter, less severe market declines over these 150 years. Consider the Rich Man’s Panic, caused by President Theodore Roosevelt’s attempt to break up large companies. Or the Baring Brothers Crisis: Barings Bank’s numerous investments in Argentina suffered when the nation faced a coup in 1891.
Yet even with those blips along the way, $100 invested at the beginning of the new millennium would be worth more than $300 as of January 2025. If that $100 had been invested back in 1870, it would be worth $3,125,500 today.
Lessons Learned About Navigating Stock Market Volatility
So, what does this history tell us about navigating volatile markets? Mainly, that they’re worth navigating.
After a couple stressful months in the first half of 2020, the markets recovered—just as they did after a 79% decline in the early 1930s. And that’s the point: Market crashes always feel scary when they happen, but there’s no way to know in the moment if you’re encountering a minor correction or looking down the barrel of the next Great Depression.
Still, even if you are looking down the barrel of the next Great Depression, history shows us that the market eventually recovers.
But since the path to recovery is so uncertain, the best way to be prepared is by owning a well-diversified portfolio that fits your time horizon and risk tolerance. Investors who stay invested in the market in the long run will reap rewards that make the turmoil worthwhile.
This article includes data and analysis from Paul Kaplan, Ph.D., CFA, former director of research with Morningstar Canada.
Data journalist Bella Albrecht and editorial manager Lauren Solberg also contributed to this article.
The author or authors do not own shares in any securities mentioned in this article. Find out about Morningstar's editorial policies.