Enbridge Inc ENB

Morningstar Rating
Add To Portfolio
|%
Chart Data Not Available
  • Last Close
  • Sector
  • Industry
  • Investment Style
    Large Core
  • Market Cap
  • Forward Div Yield
    6.00%
  • Trailing Div Yield
  • Price/Sales
    2.69
  • Price/Book
    2.25
  • Beta (5-Year)
    0.92
  • Consensus Forward P/E
    20.33
  • Trailing 12-mo Rev

Morningstar's Analysis

Valuation Aug 27, 2024
Currency in CAD
Is it the right time to buy or sell?
Fair ValueLearn Moreplay
1-Star Price
Premium
Economic Moat
Premium
5-Star Price
Premium
Capital Allocation
Premium
Enbridge Is Adding to Its Utilities Exposure
Author Photo
Andrew Bischof, CFA
Strategist
Business Strategy and Outlook | by Andrew Bischof, CFA Updated Sep 11, 2024

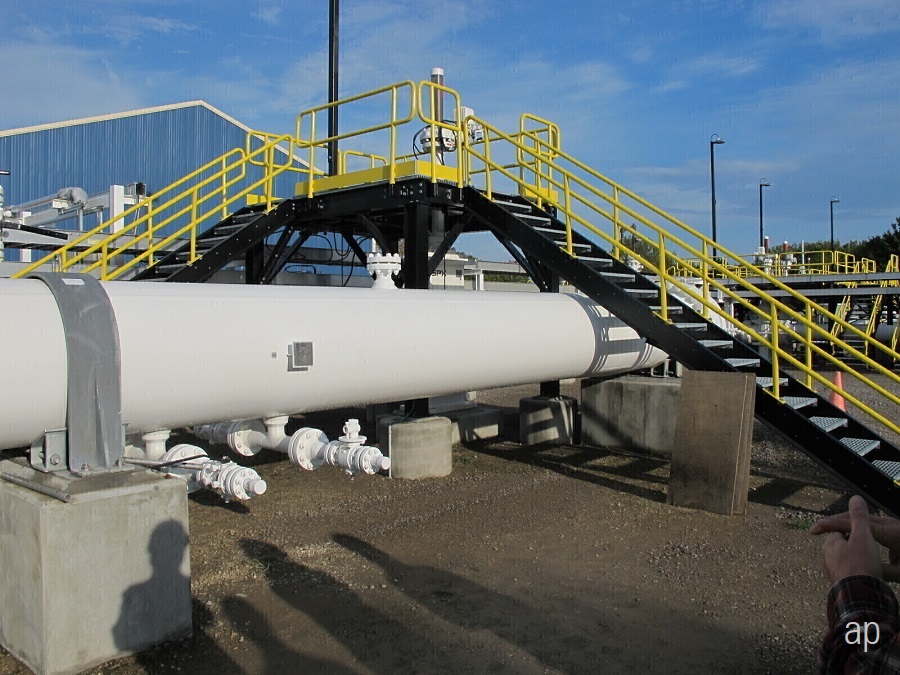
Enbridge stands out among North American midstream operators with a utilitylike earnings profile. Its most important asset, the Mainline system, controls over 70% of Canada's takeaway capacity and is linked to highly complex US refineries that value heavy oil, so demand remains secure in the near to medium term despite the increase in US light oil

Morningstar Fair Value Estimate
The Morningstar Fair Value Estimate guides investors to the long-term, intrinsic value of a stock, helping them see beyond the present market price.

Show me how fair value is derived (00:41)

Morningstar calculates the fair value estimate of a company based on a projection of how much cash the company will generate in the future. Morningstar analysts create custom industry and company assumptions to feed income statement, balance sheet, and capital investment assumptions into a proprietary discounted cash flow modeling template. Scenario analysis, in-depth competitive advantage analysis, and a variety of other analytical tools are used to augment the discounted cash flow process. The analyst discounts future cash flows using the weighted average of the costs of equity, debt, and preferred stock (and any other funding sources), using expected future proportionate long-term, market-value weights.

The Morningstar Fair Value Estimate is a projection/opinion and not a statement of fact. If Morningstar's base-case assumptions are true the market price will converge on Morningstar's fair value estimate over time, generally within three years. Investments in securities are subject to market and other risks. Past performance of a security may or may not be sustained in the future and is no indication of future performance.

Morningstar Equity Research Methodology

Price vs. Fair Value

 
Price/Fair Value
Total Return %
Index Total Return %
2015 2016 2017 2018 2019 2020 2021 2022 2023 2024 YTD
-19.89 27.43 -8.72 -8.27 28.70 -14.88 29.58 14.07 -3.16 35.58 5.82
-8.66 21.52 9.20 -9.01 22.58 5.79 24.72 -5.55 12.22 23.07 0.94

Related

Morningstar Research
© Copyright 2025 Morningstar, Inc. All rights reserved.

Terms of Use        Privacy Policy       Disclosures        Accessibility